PUBLICATIONS
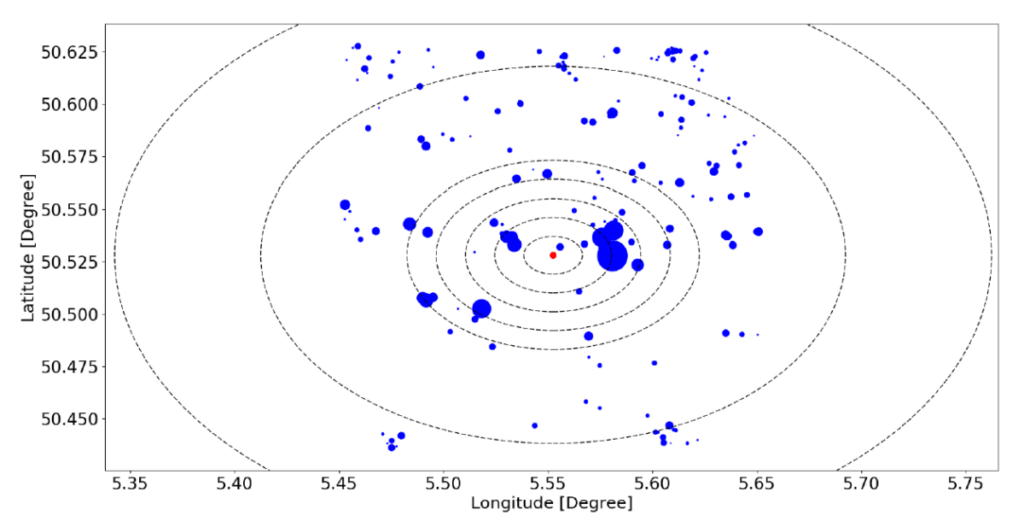 The fault detection applied to a large amount of small distributed PV systems needs to be simple, cost-effective, and reliable. This work presents a fault detection procedure applied to distributed PV system fleets, based on a novel performance indicator, designated as Performance to Peers (P2P), that can be constructed on the sole basis of the comparison of the energy production data of several neighboring PV systems. This article explains how to construct this performance indicator and how to use it to carry out automatic fault detections. This fault detection procedure has been developed in the context of the performance analysis carried out on approximately 6000 PV installations located in Europe, and it is illustrated and discussed through real application cases. The P2P has been shown to be more stable than the Performance Ratio (PR), in particular in the presence of sub-par metadata on the PV systems, and it thus constitutes a more robust performance indicator for fault detection. The stability of P2P is characterized by an Absolute Median Deviation (MAD) that is typically of 10% for hourly data and 5% for daily data. The application of P2P to fault diagnosis is illustrated on four categories of faults that are among the most frequently observed on PV systems. The main limitations of this novel methodology are discussed, and several future lines of research are suggested.
FROM VIDEO GAMES TO SOLAR ENERGY: 3D SHADING SIMULATION FOR PV USING GPU
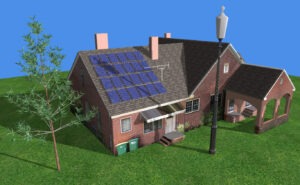
Photovoltaic (PV) systems can be affected by complex shading. Software solutions have been developed over time, offering an ever-increasing set of simulation possibilities to evaluate the energy losses induced by shading on PV systems. Yet, several practical cases cannot be satisfactorily solved by means of existing tools. This study explores the possibilities offered by the powerful graphics processing units (GPUs) that have been developed for the video game industry. It is shown that complex shading problems applicable to PV systems can be satisfactorily analyzed, both visually and quantitatively, with a focus on the rasterization process for an in-depth evaluation of the shading dynamics that affect the direct component of solar irradiance. This analysis can be conducted at high spatiotemporal resolution for maximum accuracy. Its application is illustrated based on several practical cases that are typically encountered in the world of PV systems engineering, such as building-integrated PV (BIPV) on large and complex buildings, urban PV planning, or PV plants equipped with tracking systems and installed on uneven ground. Additional advantages are also presented, including the full integration of the GPU-based shading simulation tool into a Web browser, and the use of online input information.
IEA PVPS BIPV DESIGN AND PERFORMANCE MODELLING: TOOLS AND METHODS
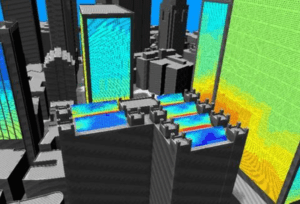
The given state-of-the-art review of BIPV design and management tools presents recent developments in BIPV modelling concerning design and management processes with different levels of detail, targeting various stakeholders and their requirements in the BIPV value chain in relation to geophysical, technical, economic and environmental aspects. It goes beyond focusing only on PV modelling and gives an overview of the BIPV tools from the perspective of BIPV integration in design and multi-performance modelling and planning. The report examines features and functions, as well as potential development and limitations of currently available tools used in BIPV planning process, including tools specifically designed for BIPV and PV tools with capacity to simulate certain BIPV cases. Moreover, report provides information on limitation and reliability of these tools in different settings and for different BIPV categories, indicating pathways and tools’ selection that would provide the highest confidence and fidelity of results as well as positive user experience throughout the process. The report streamlines workflows according to the type and complexity of BIPV integration and offers pathways and tools suitable for required case. The report included 15 domains of BIPV planning such as geophysical, technical, economic and environment which affect successful BIPV integration. 27 software, 9 online tools and 4 apps were compared against the aforementioned domains. The findings of this review showed none of the examined software and apps can cater to all the factors pertaining to PV project design and management. Results have shown that majority of tools used in BIPV modelling come from PV domain and consequently still lack important features regarding BIPV integration, especially for vertical or externally mounted BIPV. Therefore, this study propose a decision support system which will address stakeholders’ practical difficulties by providing the main features: (1) a localized data repository which will include weather information, building regulations, energy consumptions in different building sectors, utility prices, construction and maintenance costs, contract types, financial modes, carbon prices and government incentive schemes; (2) efficient 3D model creation of the physical environment; (3) Hourly comparison of energy input and output; (4) PV layout design optimization; (5) Simulated installation process and impact analysis; (6) Monitoring and inspection modules with auto diagnosing function; (7) PV system performance recording; and (8) sensitivity analysis and scenario-based decision making support.
SOLAR IRRADIATION FROM THE ENERGY PRODUCTION OF RESIDENTIAL PV SYSTEMS
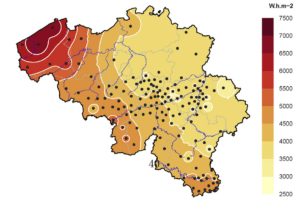 Considering the dense network of residential photovoltaic (PV) systems implemented in Belgium, the paper evaluates the opportunity of deriving global horizontal solar irradiation data from the electrical energy production registered at PV systems. The study is based on one year (i.e. 2014) of hourly PV power output collected at a representative sample of roughly 1500 residential PV installations. Validation is based on ground-based measurements of solar radiation performed within the network of radiometric stations operated by the Royal Meteorological Institute of Belgium and the method’s performance is compared to the satellite-based retrieval approach. Our results indicate that the accuracy of the derived solar irradiation data depends on a number of factors including the efficiency of the PV system, the weather conditions, the density of PV systems that can be used for the tilt to horizontal conversion, other data sources that can be accessed to complement the PV data. In particular, the computed solar irradiation data degrade as the information about the orientation and tilt angles of the PV generator becomes more inaccurate. It is also found that there are certain sun positions (i.e. low solar elevations) for which the method fails to produce a valid estimation.
MONITORING 30,000 PV SYSTEMS IN EUROPE: PERFORMANCE, FAULTS, AND STATE OF THE ART
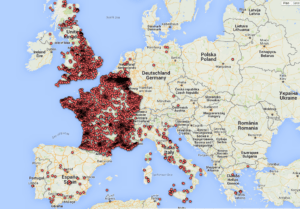 We have tried to cast some light on some of the numerous questions concerning the performance of solar PV systems in Europe. We have based our analysis on the operational data monitored at more than 31,000 PV systems in Europe. These installations comprise residential and commercial rooftop PV systems distributed over 9 different countries, including multi-megawatt PV plants installed in the South of Europe. The PV systems were installed between 2006 and 2014. The mean Energy Yield of the PV systems located in the four reference countries are 1115 kWh/kWp for France, 898 kWh/kWp for the UK, 908 kWh/kWp for Belgium, 1450 kWh/kWp for the PV plants in Spain mounted on a static structure, and 2127 kWh/kWp for those mounted on a solar tracker in Spain. We suggest that the typical PR value for the PV systems installed in 2015 is 0.81. We have observed that the performance of the PV systems tends to increase when the peak power of the PV systems increases. We have found significant performance differences as a function of the inverter manufacturer, and the PV module manufacturer and technology. We have found an improvement of the state-of-the-art, in the form of an increase in performance in the yearly integrated PR of around 3 to 4% over the last seven years, which represents an increase of about 0.5% per year.
A BANKABLE METHOD OF ASSESSING THE PERFORMANCE OF A CPV PLANT
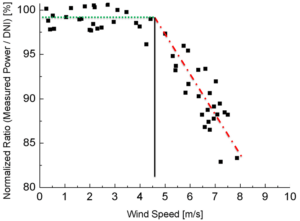 Concentrating Photovoltaics (CPV) is an alternative to flat-plate module photovoltaic (PV) technology. The bankability of CPV projects is an important issue to pave the way toward a swift and sustained growth in this technology. The bankability of a PV plant is generally addressed through the modeling of its energy yield under a baseline loss scenario, followed by an on-site measurement campaign aimed at verifying its energy performance. This paper proposes a procedure for assessing the performance of a CPV project, articulated around four main successive steps: Solar Resource Assessment, Yield Assessment, Certificate of Provisional Acceptance, and Certificate of Final Acceptance. This methodology allows the long-term energy production of a CPV project to be estimated with an associated uncertainty of ≈5%. To our knowledge, no such method has been proposed to the CPV industry yet, and this critical situation has hindered or made impossible the completion of several important CPV projects undertaken in the world. The main motive for this proposed method is to bring a practical solution to this urgent problem. This procedure can be operated under a wide range of climatic conditions, and makes it possible to assess the bankability of a CPV plant whose design uses any of the technologies currently available on the market. The method is also compliant with both international standards and local regulations. In consequence, its applicability is both general and international.
REVIEW OF THE PERFORMANCE OF RESIDENTIAL PV SYSTEMS IN FRANCE
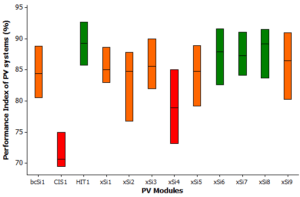 The main objective of this paper is to review the state of the art of residential PV systems in France. This is done analyzing the operational data of 6868 installations. Three main questions are posed. How much energy do they produce? What level of performance is associated to their production? Which are the key parameters that most influence their quality? During the year 2010, the PV systems in France have produced a mean annual energy of 1163kWh/kWp. As a whole, the orientation of PV generators causes energy productions to be some 7% inferior to optimally oriented PV systems. The mean performance ratio is 76% and the mean performance index is 85%. That is to say, the energy produced by a typical PV system in France is 15% inferior to the energy produced by a very high quality PV system. On average, the real power of the PV modules falls 4.9% below its corresponding nominal power announced on the manufacturer’s datasheet. A brief analysis by PV modules technology has led to relevant observations about two technologies in particular. On the one hand, the PV systems equipped with heterojunction with intrinsic thin layer (HIT) modules show performances higher than average. On the other hand, the systems equipped with the copper indium (di)selenide (CIS) modules show a real power that is 16% lower than their nominal value.
REVIEW OF THE PERFORMANCE OF RESIDENTIAL PV SYSTEMS IN BELGIUM
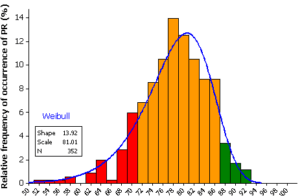 The main objective of this paper is to review the state of the art of residential PV systems in Belgium by the analysis of the operational data of 993 installations. For that, three main questions are posed: how much energy do they produce? What level of performance is associated to their production? Which are the key parameters that most influence their quality? This work brings answers to these questions. A middling commercial PV system, optimally oriented, produces a mean annual energy of 892kWh/kWp. As a whole, the orientation of PV generators causes energy productions to be some 6% inferior to optimally oriented PV systems. The mean performance ratio is 78% and the mean performance index is 85%. That is to say, the energy produced by a typical PV system in Belgium is 15% inferior to the energy produced by a very high quality PV system. Finally, on average, the real power of the PV modules falls 5% below its corresponding nominal power announced on the manufacturer’s datasheet. Differences between real and nominal power of up to 16% have been detected.
