


Published on 12 October 2026
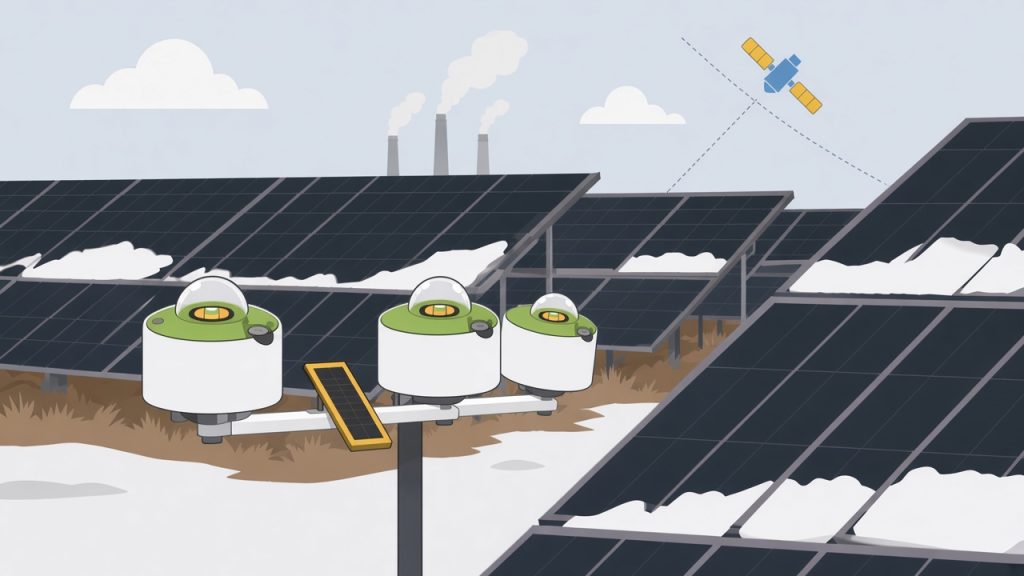
Energy yield, debt sizing, asset valuations, operational monitoring and forecasts all inherit whatever error sits in modelled solar resource data. LuciSun's site-adaptation method runs from quality control of the on-site sensor fleet to a validated, auditable irradiance series, showing where adaptation adds measurable value for each site.
A measurement architecture, not a choice between satellite and ground
On a solar plant, several elements may carry resource information, each with its own role:
- On-site sensors (pyranometers and, on some sites, reference cells or other irradiance instruments) observe the plant directly and at high frequency. They remain the reference for operational monitoring and local diagnostics, but their record is usually far too short to describe long-term climate.
- A long-term dataset, usually satellite-derived, supplies the historical depth that resource and yield studies need. It may be the historical satellite time series in LuData or a suitable third-party dataset chosen by the client. It can, however, keep site-specific systematic errors, for instance from local aerosols the model under-represents, or seasonal artefacts. The worldwide benchmark run by Task 16 of the International Energy Agency's Photovoltaic Power Systems Programme (IEA PVPS) of ten modelled datasets against 129 quality-controlled stations found that the most suitable dataset depends on site and climate [4].
- Site adaptation connects the two: over the period when both are available, it uses quality-controlled observations to make the long-term dataset representative of the site.
Our aim is neither a satellite-only strategy nor an ever-growing number of sensors. It is an architecture in which a limited number of well-maintained sensors are read continuously against an independent long-term dataset, with clear evidence on sensor quality, local bias, long-term climate behaviour and residual uncertainty. The site-adapted series then acts as analytical redundancy: an additional line of evidence that complements physical sensor redundancy rather than replacing it. Outside the period used to fit it, it offers a check on the sensors that does not depend on their own readings.
Where it changes decisions
The resource is the first input to an energy yield assessment, and a bias in it carries through to the long-term production estimate [5]. Anchoring the long-term dataset on local measurements gives a more site-specific basis for P50, P90 and other exceedance probabilities of energy yield, whether quoted for a single year or over the long term, than a purely modelled regional estimate. Where the evidence justifies it, a better-characterised and lower resource uncertainty can support the conservative production cases used in debt sizing and financial models. The size of any gain depends on the site, the dataset and the measurements [2]; it has to be demonstrated, not assumed. Adapting modelled data to coincident ground measurements is common practice in detailed resource assessments and is often requested in project financing [3]. Where the data support it, it makes satellite data more reliable for each of the uses below.
The same work pays off well beyond financial close:
- Operating plants. The adapted series gives independent long-term context for separating irradiance-driven changes in output from genuine under-performance, and for revisiting the expected energy baseline after months or years of operation.
- Monitoring platforms and portfolios. Where a monitoring platform already collects irradiance data across many sites, the same approach can be applied plant by plant to offer site-adapted historical irradiance, typical meteorological years (TMY) and P50 values, together with continuously adapted forecasts for the coming days. Every site in the portfolio is then available in the LuData API and can be queried individually.
- Refinancing, acquisition, divestment and technical due diligence. Locally validated long-term data with a documented uncertainty budget is a firmer basis for revising yield assumptions than either a short measurement series or an unadapted model on its own.
- Sensor fleet decisions. The fleet review shows which instruments can be trusted and informs replacement and redundancy choices.
- Changing or comparing data sources. Because the method is not tied to one solar database, an existing ground reference can be used to evaluate, and where relevant adapt, another hourly or sub-hourly dataset, so resource assumptions can be re-examined without depending on a single provider.
Step A: scoping, data intake and choice of long-term dataset
- Collect plant, sensor and measurement metadata: sensor plane, calibration and maintenance history, and the layout information needed to judge representativeness.
- Ingest the irradiance series of every sensor on site, then establish their time conventions, granularity and usable common period.
- Select or integrate a long-term dataset that covers both the common period and the historical period of interest.
- Harmonise units, time zone, timestamp convention, time resolution and variable definitions before any comparison.
- Record the provenance, version and uncertainty assumptions of the chosen dataset.
A third-party dataset is accepted when it offers enough historical depth, an overlap with the measurements, documented variables and units, reliable timestamp information, adequate continuity, consistency over time and, where available, an uncertainty characterisation suited to the intended use. If the dataset provides global horizontal irradiance (GHI) while the sensors measure in the plane of array (POA), the appropriate decomposition and transposition chain becomes part of the assessment. If it already provides a compatible POA series, no extra transposition term is added by default. We also check the long-term series for global dimming or brightening trends, so that the historical period retained stays representative of the site's present climate rather than reaching back over years that no longer apply.
Step B: quality control of the whole sensor fleet
Where a plant has several pyranometers, we review the entire fleet before deciding which series to use, rather than picking one instrument by default. The review follows the quality control (QC) protocols we use in our Technical Advisory work. It covers data availability, physical plausibility, daytime zeros, time shifts, orientation consistency, gain and offset behaviour, drift, soiling or shading signatures, deviations between sensors, and calibration and maintenance metadata. The long-term dataset can help screen some issues, such as a sensor that is not level or a recurring shading pattern, but it is never the only judge: to avoid circular reasoning, the decisive evidence comes from the measurements themselves, through agreement between sensors on site and, where global, direct and diffuse components are measured, closure tests between them, combined with expert visual inspection [7].
The output is a documented selection: which sensors are suspect, which one or more series are representative and reliable, and which periods are excluded and why. On spatially heterogeneous sites, several sensors or zones may be retained instead of imposing a single ground reference on the whole plant.
For new campaigns intended for high-accuracy or high-bankability studies, we recommend ISO 9060:2018 Class A "spectrally flat" pyranometers [6]. Older or lower-class instruments on existing plants are not ruled out automatically; their suitability is judged through the same review. Number, class and placement stay project-specific, depending on plant extent, terrain, spatial variability, monitoring objectives and the hardware redundancy sought.
Steps C and D: diagnose the error, then adapt and validate
Before any correction, the selected ground series are compared with the long-term dataset monthly and, where the data allow, at hourly or sub-hourly resolution. Monthly comparisons reveal seasonal deviations, often in low-sun periods, and systematic offsets such as aerosol-related bias. Finer-resolution residuals, examined by time of day, season, sky condition and sun geometry, show whether the deviation is roughly constant or depends on conditions that an annual bias would mask. The aim is to understand the structure of the error before deciding how, or whether, to correct it.
The correction is usually applied to GHI, or to plane-of-array irradiance (POA) where only plane-of-array sensors are available. A site-specific relationship between the retained ground observations and the long-term dataset is established over the common period, then transferred to the full historical series while preserving its long-term climate variability. Several method families exist, including regression-based methods, quantile or distribution mapping, condition-dependent approaches and combinations of these [1, 3, 8], and benchmarking within IEA PVPS Task 16 showed that no single approach is best for every site, irradiance component and dataset [2]. The choice of method is therefore driven by the diagnosis and the evidence, not by habit.
Common period. About one to two years of simultaneous measurements is a solid base, because it spans the seasonal cycle. Published work indicates that very short fitting periods can produce erroneous adaptations and that a year or more of good-quality overlap is generally preferable [3].
Validation and acceptance. The original and adapted datasets are both compared with the quality-controlled ground data, on independent validation data where the common period allows, for example by cross-validation across months, to limit overfitting [3]. Because no single statistic describes an irradiance series fully, the comparison combines bias, dispersion (mean absolute error and root mean square error), correlation and distribution similarity, and checks monthly and annual irradiation separately. The adaptation is retained only when the evidence shows a robust improvement without unrealistic seasonal behaviour or loss of physical plausibility. Sometimes the original dataset already agrees well with the measurements, or the data cannot support a robust correction; published benchmarks also show that an unsuitable correction or poor ground data can bring little benefit, or leave the dataset worse than before [1, 2]. A valid conclusion can therefore be to keep the original dataset, restrict the adaptation to an appropriate scope, or deliver it with explicit reservations.
Step E: uncertainty, assessed component by component
We do not apply one generic percentage. The uncertainty of the original long-term dataset (including any transposition to the measurement plane), that of the retained ground measurements, and that of the adaptation and its residual error are assessed separately, together with the representativeness of a limited common period. Keeping them apart also shows whether observed differences between the ground measurements and the long-term dataset are significant at all. Components are combined in quadrature only when their independence is justified, with correlations and double counting examined explicitly, in line with the international Guide to the Expression of Uncertainty in Measurement (GUM) [9]. Interannual variability is reported outside this budget: it describes year-to-year climate rather than measurement or model error, and its use in P50, P90 and similar calculations depends on the framework of the yield study.
Step F: what the client receives
The delivery is designed so that the client, a lender's engineer or an independent reviewer can follow every choice. Clients receive the validated ground measurements, with excluded periods documented; the long-term dataset in its original form alongside the site-adapted series; comparative validation results for both against the measurements; the uncertainty assessment; and the documented assumptions, limitations and intended use. Scope is set site by site, depending on the number of sensors, data quality, the long-term source, the required output resolution and the expected depth of validation.
Historical adaptation is not forecast calibration
The same quality-controlled measurements can later serve operations, but the two tasks are different:
- Historical site adaptation anchors a multi-year series for yield assessment, P50 and P90 values and financing. It can be a one-off exercise for a given site.
- Forecast calibration trains a statistical correction or post-processing layer on the overlap between archived forecasts and site measurements (irradiance and, where relevant, plant output) to reduce local bias in forecasts used for operations, trading or dispatch. It applies across forecast horizons, to deterministic forecasts based on numerical weather prediction (NWP) as well as site-specific probabilistic forecasts, where the correction must keep the predicted spread realistic, not only the central value.
Forecast errors depend on lead time and weather situation, so a correction derived for the historical series cannot simply be transplanted onto a forecast feed. A forecast correction needs its own training data, in practice often around one to two years of hourly or finer measurements after QC, and its own verification with forecast-skill metrics, plus, for probabilistic forecasts, checks that the predicted ranges match what is actually observed; it leaves the historical P50 and P90 unchanged. Both tasks depend on sound ground data: calibrating a forecast to a drifting sensor carries that drift into the operational feed. LuData already delivers deterministic NWP forecasts and site-specific probabilistic forecasts through its API; site adaptation of these feeds to a plant's own measurements can be configured as a premium Technical Advisory and software service, separate from the standard subscription.
Working with LuciSun
Site adaptation is delivered through our Technical Advisory services, for developers, independent power producers, asset owners, lenders and owner's engineers, and for data providers and engineering or resource consultancies that need independent QC and adaptation. If you have a campaign under way, a sensor fleet you are unsure about, or measurements that have never been used to adapt a long-term series or a forecast, we can review what the data support.
Request our client technical note. Prospective clients can request a more detailed document covering our methodology, validation principles, uncertainty treatment, deliverables and project-specific considerations. It is a practical resource when planning a measurement campaign, commissioning a resource or yield assessment, or reviewing the resource basis of an existing project. Ask for it through the contact form, book an intro call to discuss your site, or open a support ticket.
References
- Polo, J., Wilbert, S., Ruiz-Arias, J.A., Meyer, R., Gueymard, C., Šúri, M., et al. (2016). Preliminary survey on site-adaptation techniques for satellite-derived and reanalysis solar radiation datasets. Solar Energy, 132, 25–37. https://doi.org/10.1016/j.solener.2016.03.001
- Polo, J., Fernández-Peruchena, C., Salamalikis, V., Mazorra-Aguiar, L., Turpin, M., Martín-Pomares, L., Kazantzidis, A., Blanc, P., Remund, J. (2020). Benchmarking on improvement and site-adaptation techniques for modeled solar radiation datasets. Solar Energy, 201, 469–479. https://doi.org/10.1016/j.solener.2020.03.040
- Fernández-Peruchena, C.M., Polo, J., Martín, L., Mazorra, L. (2020). Site-adaptation of modeled solar radiation data: The SiteAdapt procedure. Remote Sensing, 12(13), 2127. https://doi.org/10.3390/rs12132127
- Forstinger, A., Wilbert, S., Jensen, A.R., Kraas, B., Fernández Peruchena, C., Gueymard, C.A., et al. (2023). Worldwide Benchmark of Modelled Solar Irradiance Data. IEA PVPS Task 16, Report IEA-PVPS T16-05:2023. https://iea-pvps.org/wp-content/uploads/2023/06/IEA-PVPS-T16-05-2023-Worldwide-Benchmark-Modelled-Solar.pdf
- Sengupta, M., Habte, A., Wilbert, S., Gueymard, C., Remund, J., Lorenz, E., van Sark, W., Jensen, A.R. (2024). Best Practices Handbook for the Collection and Use of Solar Resource Data for Solar Energy Applications: Fourth Edition. National Renewable Energy Laboratory, NREL/TP-5D00-88300. https://doi.org/10.2172/2448063
- International Organization for Standardization (2018). ISO 9060:2018 Solar energy – Specification and classification of instruments for measuring hemispherical solar and direct solar radiation. ISO, Geneva. https://www.iso.org/standard/67464.html
- Forstinger, A., Wilbert, S., Jensen, A.R., Kraas, B., Fernández Peruchena, C., Gueymard, C.A., et al. (2021). Expert quality control of solar radiation ground data sets. In Proceedings of the ISES Solar World Congress 2021, pp. 1037–1048. https://doi.org/10.18086/swc.2021.38.02
- Dhata, E.F., Kim, C.K., Kim, H.-G., Kim, B., Oh, M. (2022). Site-adaptation for correcting satellite-derived solar irradiance: Performance comparison between various regressive and distribution mapping techniques for application in Daejeon, South Korea. Energies, 15(23), 9010. https://doi.org/10.3390/en15239010
- Joint Committee for Guides in Metrology (2008). JCGM 100:2008 Evaluation of measurement data – Guide to the expression of uncertainty in measurement (GUM). BIPM. https://www.bipm.org/documents/20126/2071204/JCGM_100_2008_E.pdf
Planning a campaign or reviewing a project? Let's talk.

 English
 French
 Spanish